
What Signal are Oil Inventories Sending
The S&P 500 Has a Built-In Source of Demand
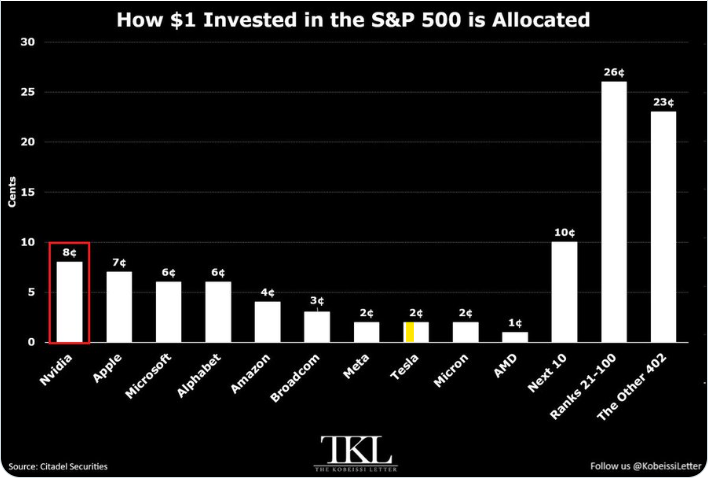
The S&P 500 contains roughly 500 companies, but every new dollar invested is heavily weighted toward its largest stocks. As the chart illustrates, about 41 cents of every dollar goes to the ten largest companies, with Nvidia, Apple, Microsoft and Alphabet receiving particularly large allocations.
An important part of this story is the steady flow of retirement savings into U.S. markets. Every month, workers contribute to 401(k)s and other retirement accounts, while IRA assets are also invested through mutual funds and ETFs. When those dollars are directed into an S&P 500 index fund, the fund must purchase stocks according to their index weights.
Think Further
This creates a structural source of recurring demand for the largest companies. As a company's market value increases, its S&P 500 weight can rise, meaning subsequent index-fund inflows allocate even more dollars to it.
This doesn't guarantee that these stocks will continue rising—fundamentals, valuations and investor withdrawals still matter. But it helps explain why the largest index constituents can receive substantial ongoing support from passive investment flows.
The takeaway: Owning the S&P 500 isn't simply owning 500 companies equally. New index-fund dollars disproportionately flow toward today's largest companies.
Source: Citadel Securities / The Kobeissi Letter.
What Signal are Oil Inventories Sending
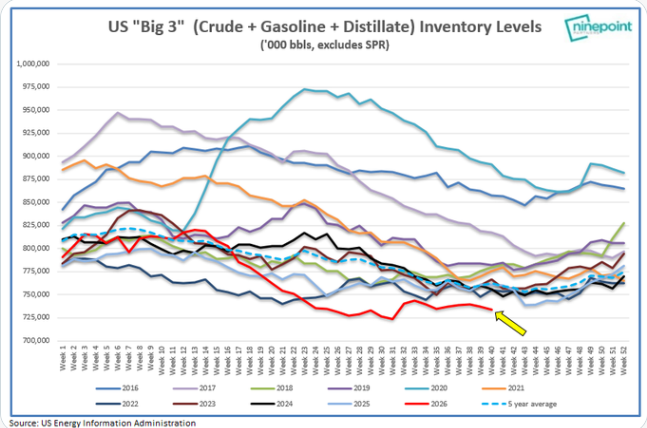
The message from this chart is relatively simple: U.S. petroleum inventories are unusually low for this time of year.
Each line represents combined inventories of crude oil, gasoline and distillates for a different year. The red line represents 2026, showing inventories near the bottom of the historical range and below the five-year average.
Think Further
Low inventories mean there is less of a supply cushion if demand strengthens or production is disrupted. That can make oil prices more sensitive to geopolitical events, hurricanes, refinery problems or unexpected increases in demand.
For investors, this environment can be supportive for oil prices, energy producers and refiners. There is also a broader economic implication: higher energy prices can contribute to inflation and potentially keep interest rates higher for longer.
The takeaway: Low inventories don't guarantee higher oil prices, but they suggest a tighter supply-demand balance and greater sensitivity to disruptions.
Source: U.S. Energy Information Administration; Ninepoint Partners.
Disclaimer: For general informational purposes only and not investment advice.
The table below reflects trend signals published by Hedgeye Risk Management as of September 17, 2026.
These signals are one input among many considered by our investment team and may not align with positioning in any client portfolio. Individual securities and commodities referenced may not be suitable for any particular investor. Clients should not act on this information without consulting their portfolio manager.
Tactical Trend Changes📈
Technical trends are analytical observations and do not guarantee future results
Natural Gas………..Bearish to Bullish
Energy Securities…Bearish to Bullish
Bullish: a view that the price of a security or market may rise, subject to significant uncertainty and risk of loss. Bearish: a view that the price may fall, subject to significant uncertainty and risk of loss. Neutral: a view that the price may remain relatively stable. These terms reflect third-party and/or general market views and are not recommendations or predictions.